...
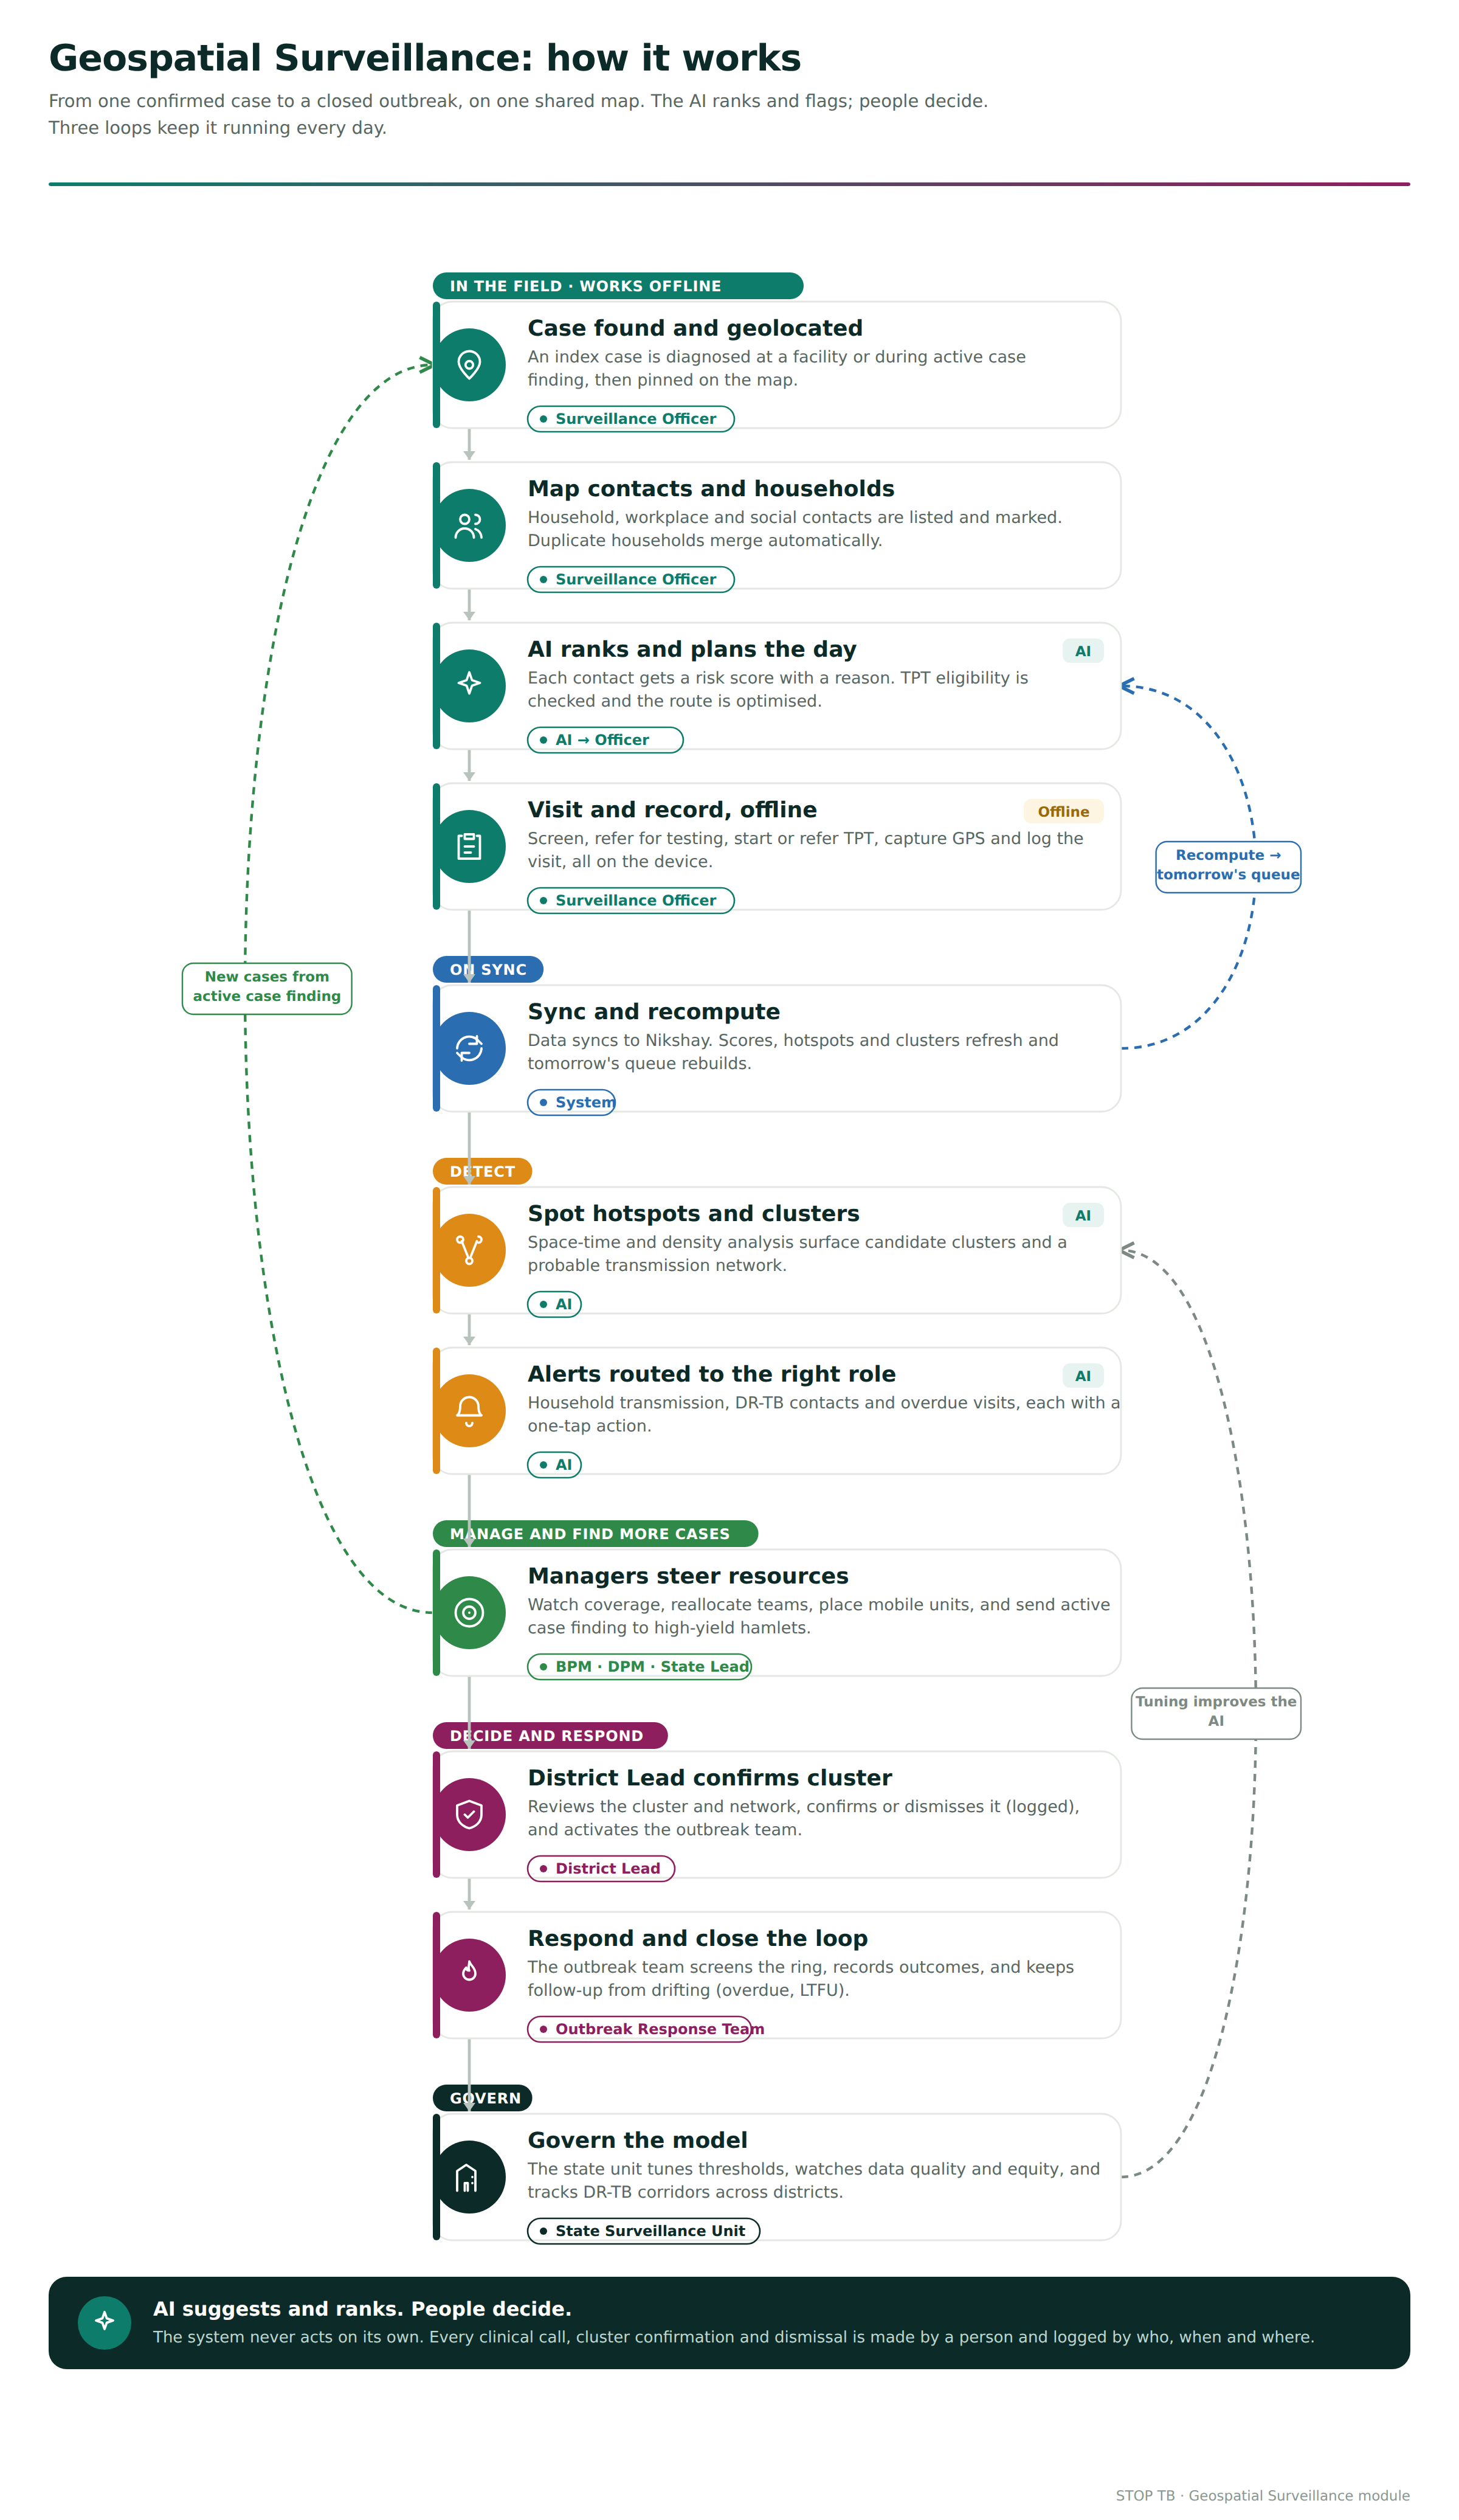
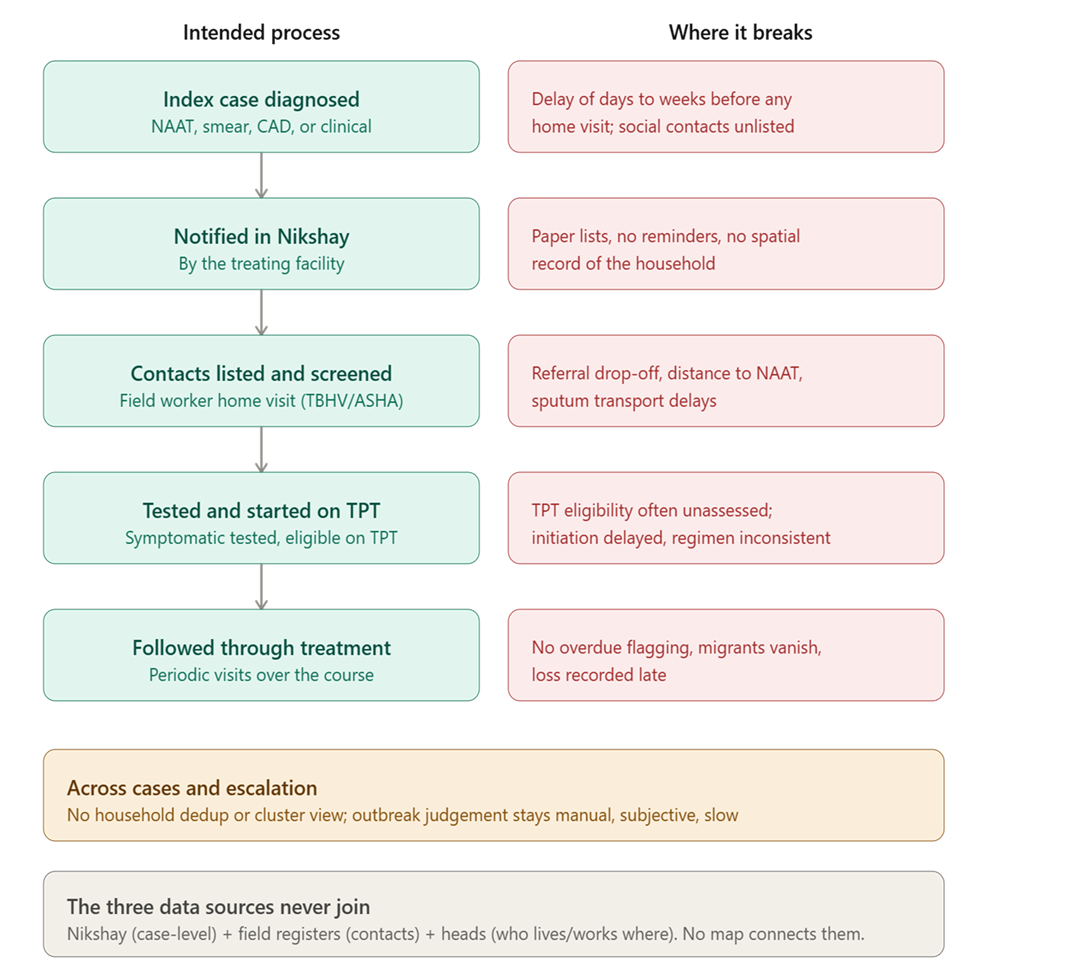
An index case is diagnosed (NAAT, smear, CXR-based CAD, or clinical) at a health facility or during active case finding.
The case is notified in Nikshay by the treating facility.
Household contacts are meant to be listed and screened. In practice this depends on a field worker (TBHV/STS/ASHA) visiting the home, asking about symptoms, and recording contacts on paper or in a basic form.
Symptomatic contacts are referred for testing. Asymptomatic eligible contacts (household contacts, especially children under five and people living with HIV) are meant to be evaluated for TPT and initiated.
Contacts and the index case are followed through treatment with periodic visits.
Where it breaks
Stage | Bottleneck / gap |
Index notified —› contacts listed | Delay of days to weeks before anyone visits the home. Occupational and social contacts rarely captured at all. |
Contacts listed —› screened | Paper lists; no reminders; incomplete symptom capture; no spatial record of the household. |
Screening —› testing | Referral drop-off; distance to nearest NAAT site; sputum transport delays. |
Eligible —› TPT initiated | TPT eligibility often not assessed; initiation delayed; regimen choice inconsistent. |
Follow-up of cases | No overdue-visit flagging; No deduplication of households, no cluster view, duplicated visits, missed households. |
Escalation | Cluster/outbreak judgement is manual, subjective, and slow. |
2. Proposed AI Solution
...
The dashboard is one map with toggleable layers and a linked side panel for role based views if needed (work queue on the field view, KPIs on the Surveillance Officer view).
Layer | What it shows | Notes |
Confirmed case markers | Distinct icon/colour; shape or badge for DR-TB and DS-TB | Tap for case card (respecting role-based data masking) |
Presumptive case markers | Separate style; awaiting test result | Auto-updates on result sync |
Contact markers | Coloured by risk score band | Clustered at zoom-out to avoid pin soup |
Household boundaries | Polygon or grouped pin per household | Groups all members; deduplicates visits |
Contact network links | Lines between linked cases/contacts | · Household (solid),· Occupational (dashed)· Social (dotted) |
Heat map | KDE density surface of cases | Adjustable time window |
Risk zones | Statistically significant hotspots (Gi*) | Outlined polygons with significance label |
Administrative boundaries | Village, PHC, Block, District | Standard NTEP boundary layers; selectable admin filter |
Health facilities | DMC, NAAT site, PHC, DR-TB centre | Icon by capability; shows nearest-facilityrouting |
Screening coverage | Choropleth map: % of index cases with completed contact investigation | The core quality metric, visualised |
Pending investigations | Households/contacts overdue | Colour by days-overdue |
Active treatmentlocations | Where patients are on treatment | For adherence/follow-up geography |
3. Product Requirements
Functional requirements-
...
Cross-district pattern detection, DR-TB corridor monitoring, migration-linked transmission across boundaries.
Owns model governance, threshold tuning, data quality oversight, and equity monitoring.