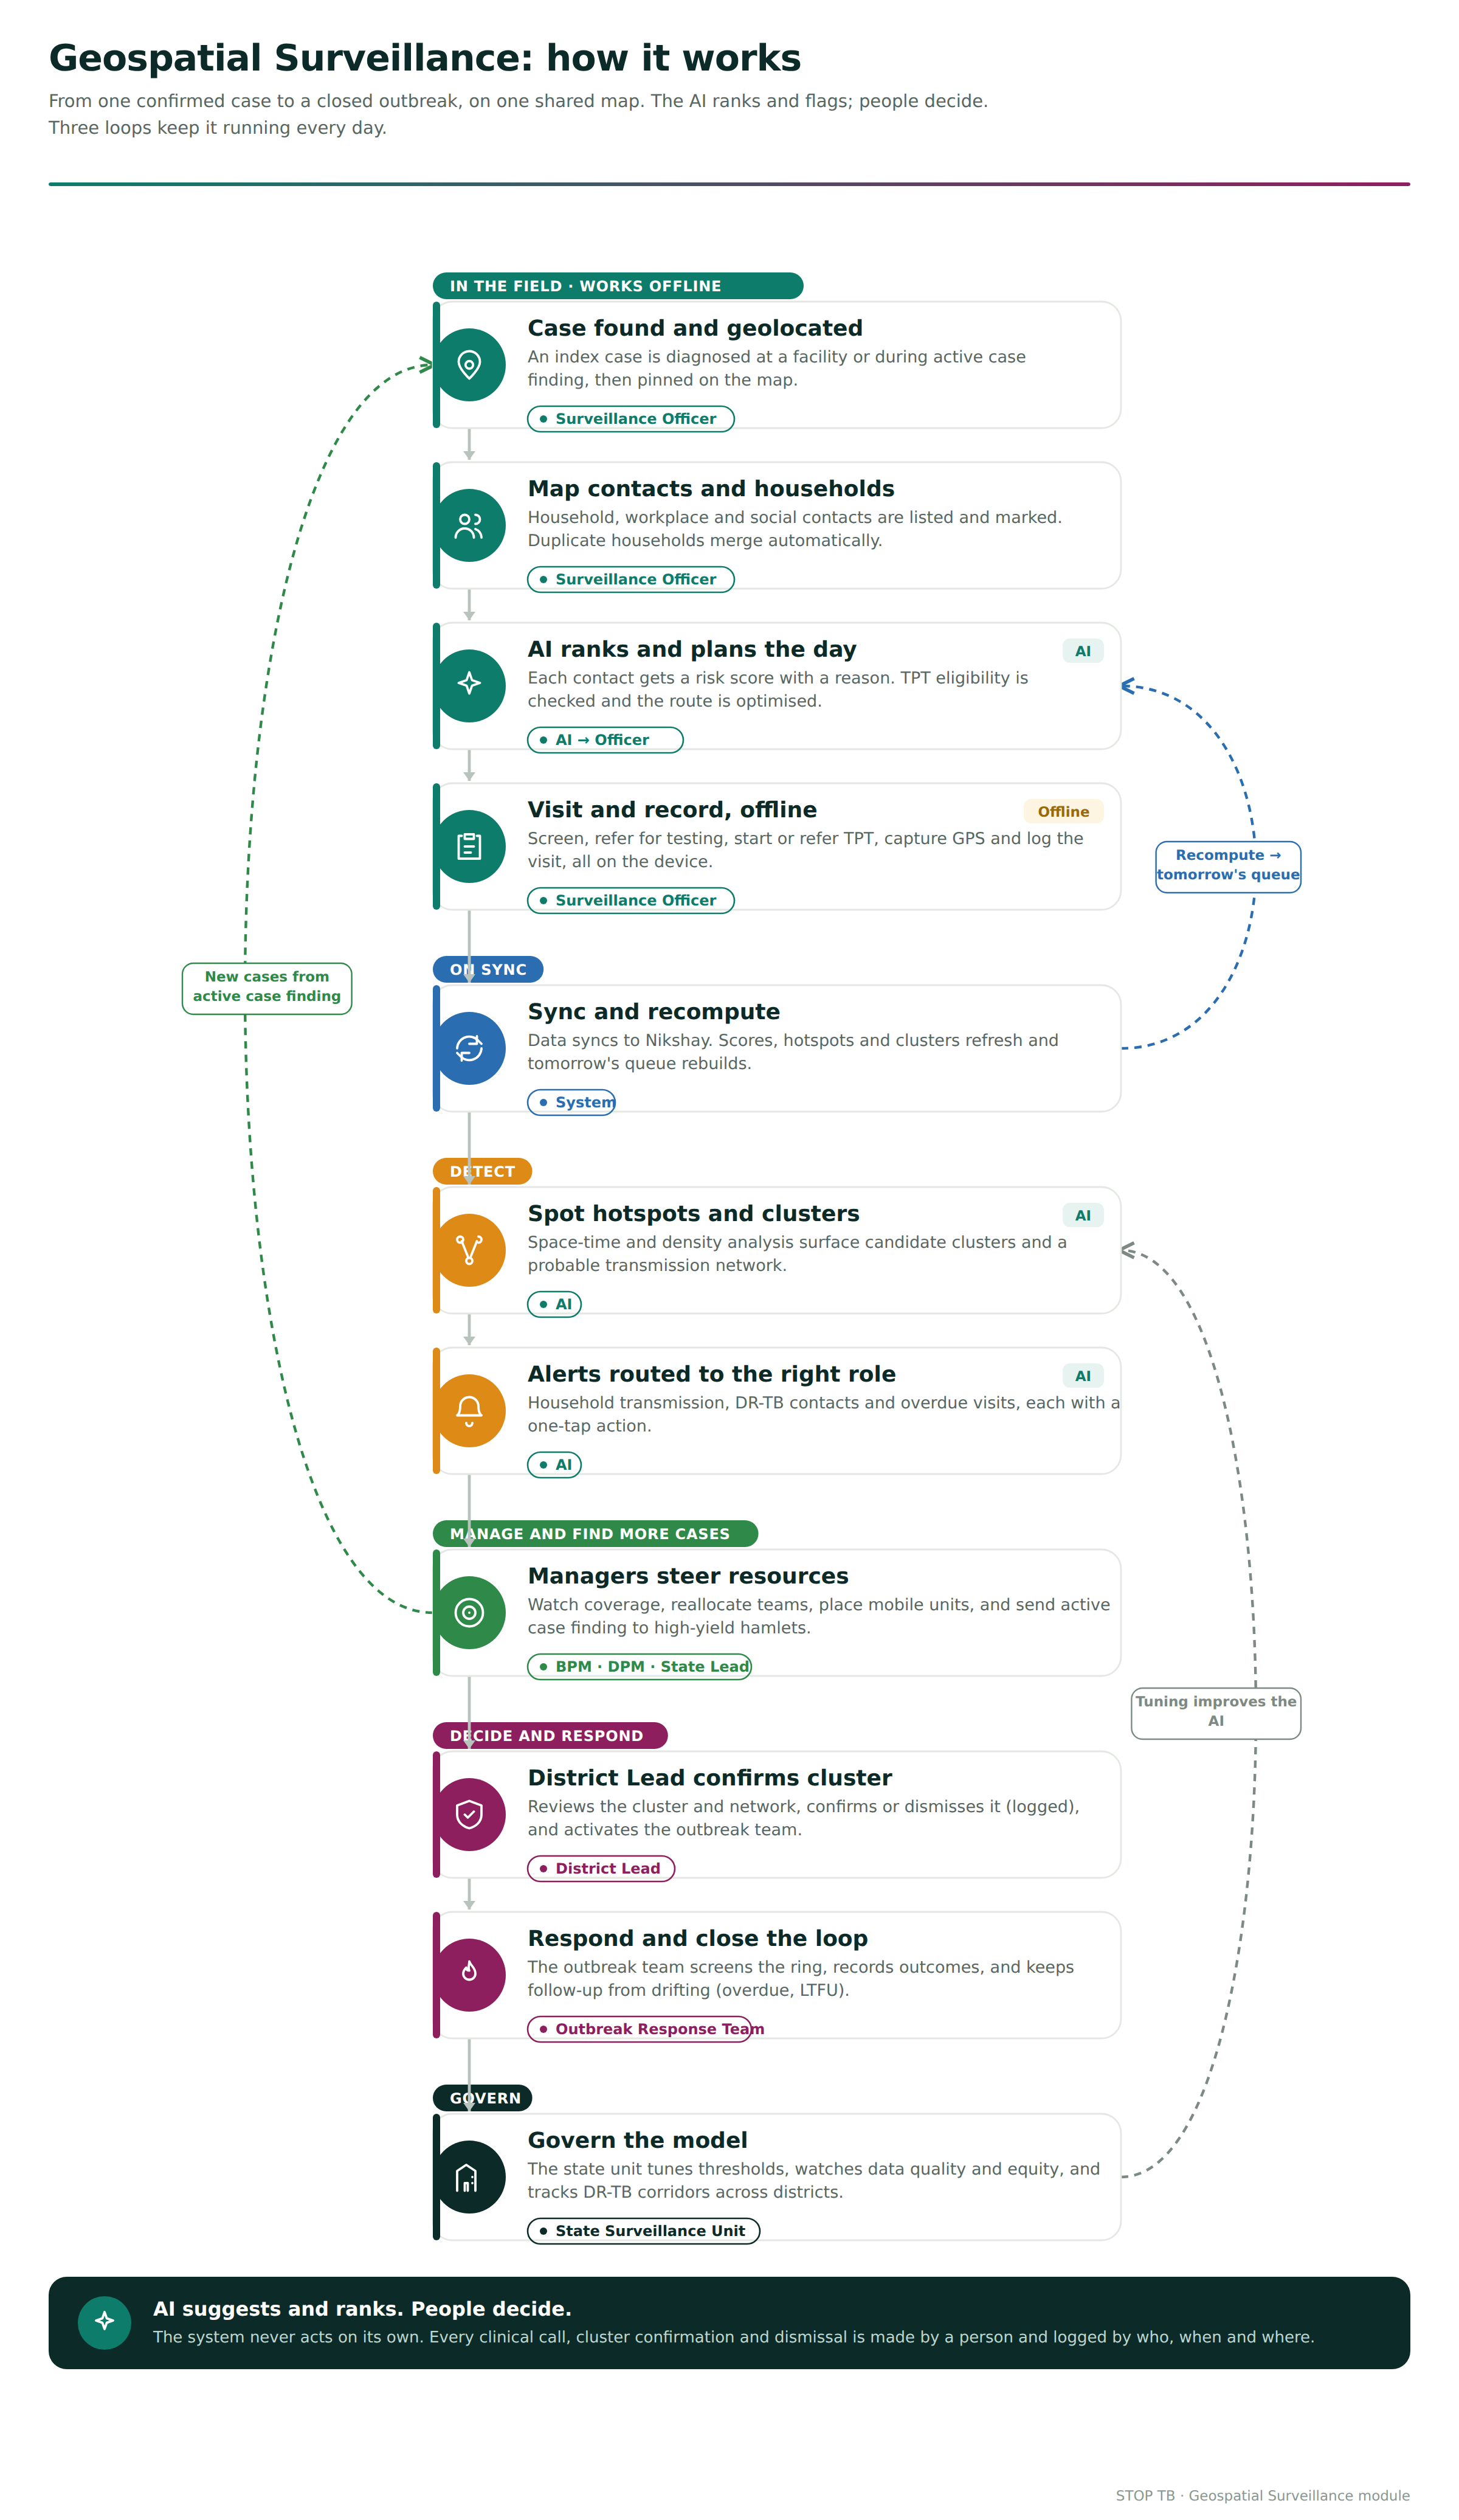
Scope: New Surveillance Officer role and capability inside the existing STOP TB field application, adding contact tracing, TPT initiation, outbreak response, and a GIS surveillance dashboard in this role.
1. Problem Statement-
Contact investigation is mandated but unevenly executed. In remote and tribal blocks the gap is worst: sparse field staff, difficult terrain, seasonal migration, weak connectivity, and no formal street addressing. A Surveillance Officer today has no spatial picture of the caseloads of their designated geography. They cannot see, on a map, where cases cluster, households having unscreened contacts, or whether three "unrelated" cases actually live within 400 metres of each other and share a water point or a worksite or any commom location.
Why current contact tracing is inefficient-
Lists, not maps. Contacts are recorded as line lists or paper registers. Spatial and social relationships between cases are invisible, so clusters go unrecognized until they are large.
No prioritization. Every contact is treated as equal effort. A child under five sharing a bedroom with a smear-positive index case is queued the same as an adult neighbor with brief exposure.
Manual, delayed cluster detection. Whether a group of cases constitutes an outbreak is decided retrospectively, often in monthly review meetings, by then the transmission window has moved on.
Duplicate and missed effort. The same household gets visited by different workers for different cases; other households are missed entirely. There is no shared, deduplicated view of "who still needs to be seen."
Address and geolocation failures. Addresses in tribal hamlets are descriptive ("behind the school, near the tamarind tree"). Revisits fail. GPS is captured inconsistently or not at all.
Follow-up attrition. People start treatment and are then lost, especially migrants and daily-wage workers. Nobody flags the drift until an outcome is recorded as failure or lost to follow up (LTFU).
How contact tracing happens today-
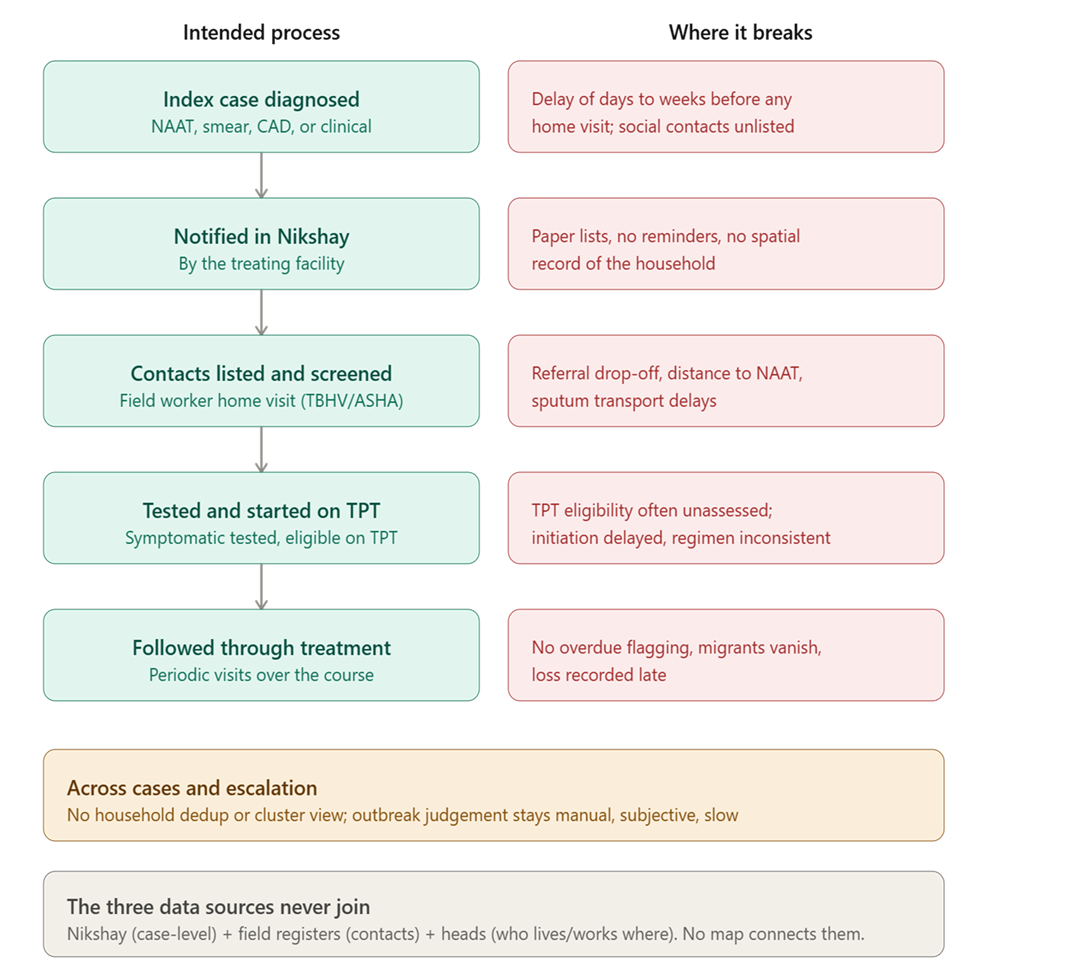
An index case is diagnosed (NAAT, smear, CXR-based CAD, or clinical) at a health facility or during active case finding.
The case is notified in Nikshay by the treating facility.
Household contacts are meant to be listed and screened. In practice this depends on a field worker (TBHV/STS/ASHA) visiting the home, asking about symptoms, and recording contacts on paper or in a basic form.
Symptomatic contacts are referred for testing. Asymptomatic eligible contacts (household contacts, especially children under five and people living with HIV) are meant to be evaluated for TPT and initiated.
Contacts and the index case are followed through treatment with periodic visits.
Where it breaks
Stage | Bottleneck / gap |
Index notified —› contacts listed | Delay of days to weeks before anyone visits the home. Occupational and social contacts rarely captured at all. |
Contacts listed —› screened | Paper lists; no reminders; incomplete symptom capture; no spatial record of the household. |
Screening —› testing | Referral drop-off; distance to nearest NAAT site; sputum transport delays. |
Eligible —› TPT initiated | TPT eligibility often not assessed; initiation delayed; regimen choice inconsistent. |
Follow-up of cases | No overdue-visit flagging; No deduplication of households, no cluster view, duplicated visits, missed households. |
Escalation | Cluster/outbreak judgement is manual, subjective, and slow. |
2. Proposed AI Solution
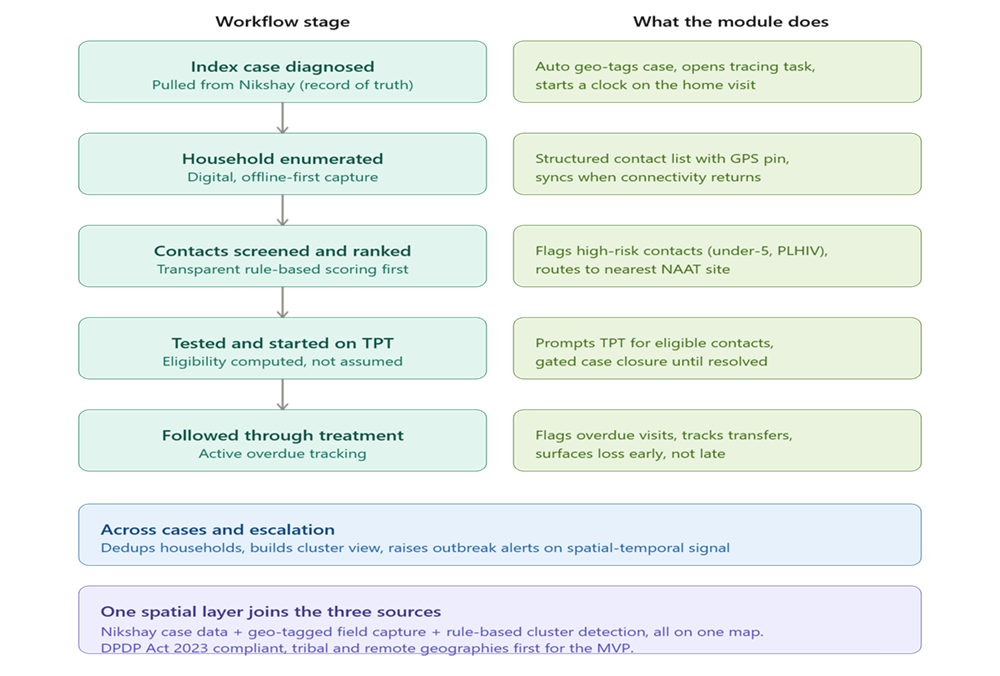
A Geospatial Surveillance and Contact-Tracing module inside STOP TB that puts every case, contact, household, and facility on a live map; uses spatial statistics and machine learning to detect clusters and rank who needs attention first; and hands the Surveillance Officer a prioritized, route-optimized work queue with explainable reasons attached.
Surveillance Officer confirms a contact relationship, deciding a case is or is not part of a cluster, judging whether an alert is a real outbreak, all clinical decisions, and any notification.
The solution should do the following-
Sees relationships across the whole caseload at once (spatial proximity, household members, onset patterns).
Ranks consistently using the same risk logic every time, so triage does not depend on which worker or which day.
Never forgets an overdue task and surfaces drift (missed households, delayed TPT, overdue visits) before it becomes an outcome.
Optimizes the logistics (which order to visit, where to place a camp) so field time goes to investigation, not planning.
Role of Geospatial Intelligence in Routine Surveillance
Detect clusters weeks earlier by watching space and time together, not case counts in isolation.
Direct active case finding to the specific hamlets where undiagnosed cases are statistically most likely, instead of blanket campaigns.
Place mobile diagnostic units and screening camps where they reach the most unscreened high-risk contacts.
Give every management tier the same map at different zoom levels, so a village-level reality and a state-level pattern are the same underlying data.
AI Capabilities
- Dynamic hotspot detection- Continuously flags geographic areas with case density significantly above the local baseline.
Method: kernel density estimation for the heat surface; Getis-Ord Gi* for statistically significant hot/cold spots; adjustable spatial bandwidth by terrain and population density.
Inputs: geolocated confirmed and presumptive cases, population denominators, time stamps.
Action: Surveillance Officer reviews the flagged area and decides on active case finding.
2. Cluster identification (space-time)- Detects groups of cases unusually close in both space and time.
Method: Kulldorff space-time scan statistic (SaTScan-style) for significance testing; DBSCAN for density-based grouping where denominators are weak; parameters tuned to tribal population sparsity.
Inputs: case coordinates, onset/notification dates, and where available drug-susceptibility results.
Action: Cluster is surfaced to Surveillance Officer as a candidate, with a confidence score, for human confirmation.
3. Contact prioritisation and risk scoring- Ranks every contact of an index case by probability of infection or progression.
Method: a transparent gradient-boosted or logistic model, with an interpretable fallback rule set for auditability.
Inputs: exposure type (household/occupational/social), proximity and duration, index case infectiousness (smear/NAAT grade, treatment status), contact age (under 5 weighted heavily), immune status (PLHIV, diabetes, malnutrition), prior TB history.
Outputs: a 0-100 score plus a plain-language reason ("child under 5, shares bedroom with smear-positive index").
Action: Work queue orders contacts by this score.
4. Probable transmission network mapping- Infers likely who-infected-whom links to guide investigation, explicitly as hypotheses.
Method: graph construction from shared households, worksites, and social links; edge weighting by spatial proximity, temporal ordering of onset, and (where genomic data exists) WGS SNP distance. Presented as a network graph, never as fact.
Inputs: case relationships, onset dates, coordinates.
Action: outbreak team uses the graph to decide investigation sequence.
5. Predictive identification of undiagnosed cases- Estimates where active but undiagnosed cases most likely exist.
Method: spatial risk modelling combining known case density, contact-investigation gaps, and area risk covariates
Output : a ranked list of villages/hamlets with expected yield.
Inputs: notification history, screening coverage gaps, socio-environmental covariates.
Action: drives active case finding site selection.
6. TPT eligibility prioritization- Surfaces contacts eligible for TB Preventive Treatment and orders them by urgency.
Method: rule engine encoding NTEP TPT eligibility (household contacts, children under 5, PLHIV, other risk groups etc), layered with the risk score.
Outputs: eligible list, suggested regimen category per NTEP (for example shorter rifampicin-based regimens where applicable), and days-overdue.
Action: Surveillance Officer initiates or refers for TPT; clinician confirms regimen.
7. Automated alerts for emerging outbreaks- Pushes alerts when cluster or hotspot thresholds are crossed.
Method: threshold and statistical triggers running on each sync.
Action: tiered escalation to the right role.
8. Route optimisation for field workers Sequences a day's visits to minimise travel while respecting priority and time windows.
Method: capacitated vehicle-routing solver with terrain-aware travel-time estimates and offline-cached road/track data; respects household availability windows.
Inputs: pending high-priority visits, officer start point, terrain.
Action: Surveillance Officer gets an ordered route, editable, on the map.
9. AI-assisted investigation recommendations For a given index case, suggests the next best actions.
Method: recommendation logic over case context ("index is DR-TB: prioritise DST for all symptomatic contacts"; "three cases in 300m in 60 days: recommend village-level ACF") where every recommendation is based on the most recent and updated government guidelines.
Action: shown as suggestions the officer accepts, edits, or dismisses (dismissals are logged for model review).
Geospatial Map Design (GIS dashboard)
The dashboard is one map with toggleable layers and a linked side panel for role based views if needed (work queue on the field view, KPIs on the Surveillance Officer view).
Layer | What it shows | Notes |
Confirmed case markers | Distinct icon/colour; shape or badge for DR-TB and DS-TB | Tap for case card (respecting role-based data masking) |
Presumptive case markers | Separate style; awaiting test result | Auto-updates on result sync |
Contact markers | Coloured by risk score band | Clustered at zoom-out to avoid pin soup |
Household boundaries | Polygon or grouped pin per household | Groups all members; deduplicates visits |
Contact network links | Lines between linked cases/contacts | · Household (solid),· Occupational (dashed)· Social (dotted) |
Heat map | KDE density surface of cases | Adjustable time window |
Risk zones | Statistically significant hotspots (Gi*) | Outlined polygons with significance label |
Administrative boundaries | Village, PHC, Block, District | Standard NTEP boundary layers; selectable admin filter |
Health facilities | DMC, NAAT site, PHC, DR-TB centre | Icon by capability; shows nearest-facilityrouting |
Screening coverage | Choropleth map: % of index cases with completed contact investigation | The core quality metric, visualised |
Pending investigations | Households/contacts overdue | Colour by days-overdue |
Active treatmentlocations | Where patients are on treatment | For adherence/follow-up geography |
Multi-Level Geospatial Navigation (India to Village)
The solution should include a cascading geospatial navigation layer that connects the national picture to a single household on one continuous map. A user begins at an India view and drills down through state, district, and block to reach a village, where the existing GIS surveillance dashboard opens. This puts into practice a core design principle of the module: every management tier works from the same data, seen at a different zoom.
How it works- All levels share one geographic coordinate space, so moving between them is a true zoom rather than a switch between separate screens. When a user drills in, the surrounding areas scale outward and stay visible as context, which preserves orientation. Transitions are animated. Administrative boundaries are colour-coded by level, and each area carries an interactive summary pin. A breadcrumb trail (India, state, district, block, village) is always visible, and any step can be clicked to return to that level. A side panel shows aggregate statistics that become more granular at each descent, from national totals down to a single village.
The five levels.
- India. All states and union territories appear as distinct coloured boundaries, each with a headline indicator such as active clusters. Selecting a state zooms in.
- State. The state's districts are shown with contact-investigation coverage and cluster counts. Selecting a district zooms further.
- District. The district's blocks are shown with block-level coverage and overdue indicators.
- Block. The block's villages are shown with their names, coverage, and active-case-finding priority.
- Village. Selecting a village opens the full GIS surveillance dashboard already built into the module: index cases, household, occupational and community contacts, probable transmission links, and all existing layers, legends, filters, and the AI recommendation panel.
This feature helps a district officer, a state lead, and a surveillance officer no longer depend on separate reports or tools to understand the same outbreak. The national and village realities are the same underlying data, which supports the state function of directing diagnostics, staff, and logistics by live risk rather than historical burden.
For production, the navigation would ingest the authoritative NTEP administrative boundary layers down to sub-district, and village-level geometry where available, with case and contact positions drawn from geocoded Ni-kshay data. The design stays offline-first at the village level, preserves role-based data masking, and keeps the principle that the AI ranks and suggests while people make every clinical and confirmation decision.
3. Product Requirements
Functional requirements-
Register and geolocate index cases, contacts, and households; classify contact type (household, occupational, community/social).
Symptom screening, referral for testing, result linkage.
TPT eligibility assessment, initiation/referral, and tracking to completion.
Household deduplication and a single shared, deduplicated pending-work view.
Interactive GIS dashboard with all layers with role based access..
Risk-scored, route-optimized work queue for field users.
Cluster/hotspot detection, transmission-graph view, and the alerts.
Recommendations (with reasons, confidence, accept/dismiss, and audit logging).
Full offline capture and sync.
Non-functional requirements-
Offline-first: all core field functions work with no connectivity for extended periods; sync is delta-based and conflict-resolved.
Performance: map with typical block-level data loads in a few seconds on a mid-range Android device; queue and score recompute on sync without blocking the UI.
Scalability: architected to grow from one block to national volume without redesign (tenant-per-state, partitioned geospatial store).
Reliability and data integrity: no data loss on crash mid-visit; every record traceable to who/when/where.
Security: encryption in transit and at rest; device-level protection for cached identifiable data; remote wipe for lost devices.
Explainability and auditability: every AI output carries a reason and is logged with model version.
Accessibility and localization: multilingual, low-literacy-friendly, sunlight-readable, low-bandwidth.
Interoperability: ABDM-compliant, FHIR-based data exchange where applicable, ABHA linkage.
4. User Workflows
Surveillance Officer (primary user)
Opens app; work queue is pre-sorted by risk and overdue status; assigned area map loads from cache.
Reviews today's prioritized contacts and households; accepts or reorders the optimized route.
Travels; at each household records symptom screen, links contacts, captures/confirms geolocation, initiates or refers TPT, logs the visit. All offline.
System auto-deduplicates: if a household already exists for another index case, the officer sees the prior record instead of creating a duplicate.
On return to connectivity, data syncs in the application; new risk scores, clusters, and alerts recompute; tomorrow's queue updates.
Receives alerts (household transmission, DR-TB contact, overdue investigations) with a one-tap action.
BPM (Block Programme Manager)
Block map with coverage choropleth map (contact investigation completion, TPT initiation rate, overdue counts).
Sees which villages the model flags for active case finding and assigns to field team.
Monitors field team work queues and clearance rates; reallocates load.
DPM (District Programme Manager)
District performance view across blocks: coverage, timeliness (time from notification to investigation), overdue backlog.
Drills from a weak block into its villages and specific overdue households.
District Leads
Clinical and programmatic ownership: candidate clusters awaiting confirmation, DR-TB concentration map, TPT completion.
Confirms or dismisses Al-flagged clusters (dismissals logged).
Activates the District Outbreak Response Team when warranted.
State Leads
State map comparing districts on contact-investigation quality and outbreak status.
Directs resources (diagnostics, staff, logistics) to districts by live risk, not just historical burden.
Feeds patterns into state planning and Nikshay-based reporting.
District Outbreak Response Team
Receives a confirmed cluster with its probable-transmission graph and case list.
Uses the map to plan the ring investigation (whom to screen, in what order).
Records the response and outcomes against the cluster, closing the loop.
State Surveillance Unit
Cross-district pattern detection, DR-TB corridor monitoring, migration-linked transmission across boundaries.
Owns model governance, threshold tuning, data quality oversight, and equity monitoring.